| Month | Result summary
|
| 01 |
Information in the literature were collected and analyzed. Two works were selected for further study:
- Sarawek SASIPORN, 2007. Xanthine oxidase inhibition and antioxidant activity of an artichoke leaf extract (Cynara scolymus L.) and its compounds. Ph.D., University of Florida, 151 pages, http://gradworks.umi.com/33/27/3327379.html
- P. Praveen Kumar, S. Kumaravel, C. Lalitha, 2010. Screening of antioxidant activity, total phenolics and GC-MS study of Vitex negundo. African Journal of Biochemistry Research 4(7):191-195, http://www.academicjournals.org/AJBR/PDF/pdf2010/July/Kumar%20et%20al.pdf
|
| 02 |
Available databases were recorded and studied. Two databases were selected for further analysis:
- Raintree's Rainforest Mission, 2011 [accessed]. Tropical Plant Database. Yerba mate (Ilex paraguariensis) http://www.rain-tree.com/yerbamate.htm
- PubChem - NLM, NIH, HHS, 2011 [accessed]. Chalconaringenin - Substance Summary (SID 8790) http://pubchem.ncbi.nlm.nih.gov/summary/summary.cgi?sid=8790
|
| 03 |
National and regional range of information were subject of study. English written information were considered. Three sources of interest were selected for further study:
- Wikipedia (http://en.wikipedia.org/wiki/) with numerous references to plants specific to Romania and Transylvania such as: 'artar' (tartar maple) - Acer_tataricum and 'soc' (elder) - Sambucus_nigra
- Different databases, from which one is of interest: Herbalgram (http://cms.herbalgram.org/) refering 'usturoi' (garlic) - Garlic.html;
- Other database (not specific to Romania): http://herb.umd.umich.edu/ - A Database of Foods, Drugs, Dyes and Fibers of Native American Peoples, Derived from Plants.
- ATLAS OF SEEDS AND FRUITS OF CENTRAL AND EAST-EUROPEAN FLORA: The Carpathian Mountains Region (Vít Bojnanský and Agáta Fargašová, Springer 2007, 1046 pag.) - http://springerlink.com/content/978-1-4020-5361-0/#section=700133 - book which was actually aquisitioned later in electronic version from Springer
|
| 04 |
Were analyzed the data type of the information which defines the structure of the chemical compounds, the data type for the composition of the mixtures with biological potency, and the data type for the origin and phylogeny of the biological material.
Executive summary (in Romanian): În ceea ce priveste structura, informatia este complexa, definind relatii "many-to-many" la nivel topologic si coordonate relative la nivel topografic. Informatia utila din analiza structurii însa nu are acelasi nivel de complexitate, fiind necesar pentru caracterizarea structurii o valoare numerica sau cel mult un sir de valori numerice care sa dea o expresie a contributiei structurii în manifestarea activitatii. Stocarea în schimb a doar acestei valori reduce complexitatea initiala, motiv pentru care s-a ales pastrarea în baza de date a structurii native, însa într-o forma procesabila catre informatia dorita. S-a definit un tip "text" pentru informatia de structura, care sa contina graful molecular în model tridimensional. Compozitia amestecurilor este definita de doua elemente - compus si respectiv pondere (concentratie, fractie molara, etc.) în amestec, asa încât pe lânga informatia stocata cu privire la structura s-a ales sa se stocheze informatia legata de denumire/identificare compus (tip "text") si pondere (tip "numeric"). Informatia de activitate antioxidanta la rândul ei este definita de doua elemente - denumire (ce caracterizeaza si procedura experimentala de determinare, tip "text") si valoare (tip "numeric"). Informatia ce defineste genotipul este o informatie eminamente de clasificare optându-se astfel pentru varianta de stocare tip "text".
|
| 05 |
Three dimensional structure of the chemical compounds has a major implication for the biological activity. The complex type of the 3D structure of the chemical compounds were taken into a deeper study. Storing as the chemical structure as text file was done.
A table with four fields were created for storing the chemical compounds: Id (identifier), CID (PubChem ID), Names (text), Structure (3D, in full), Structure (3D, hydrogen depleted).
Image: 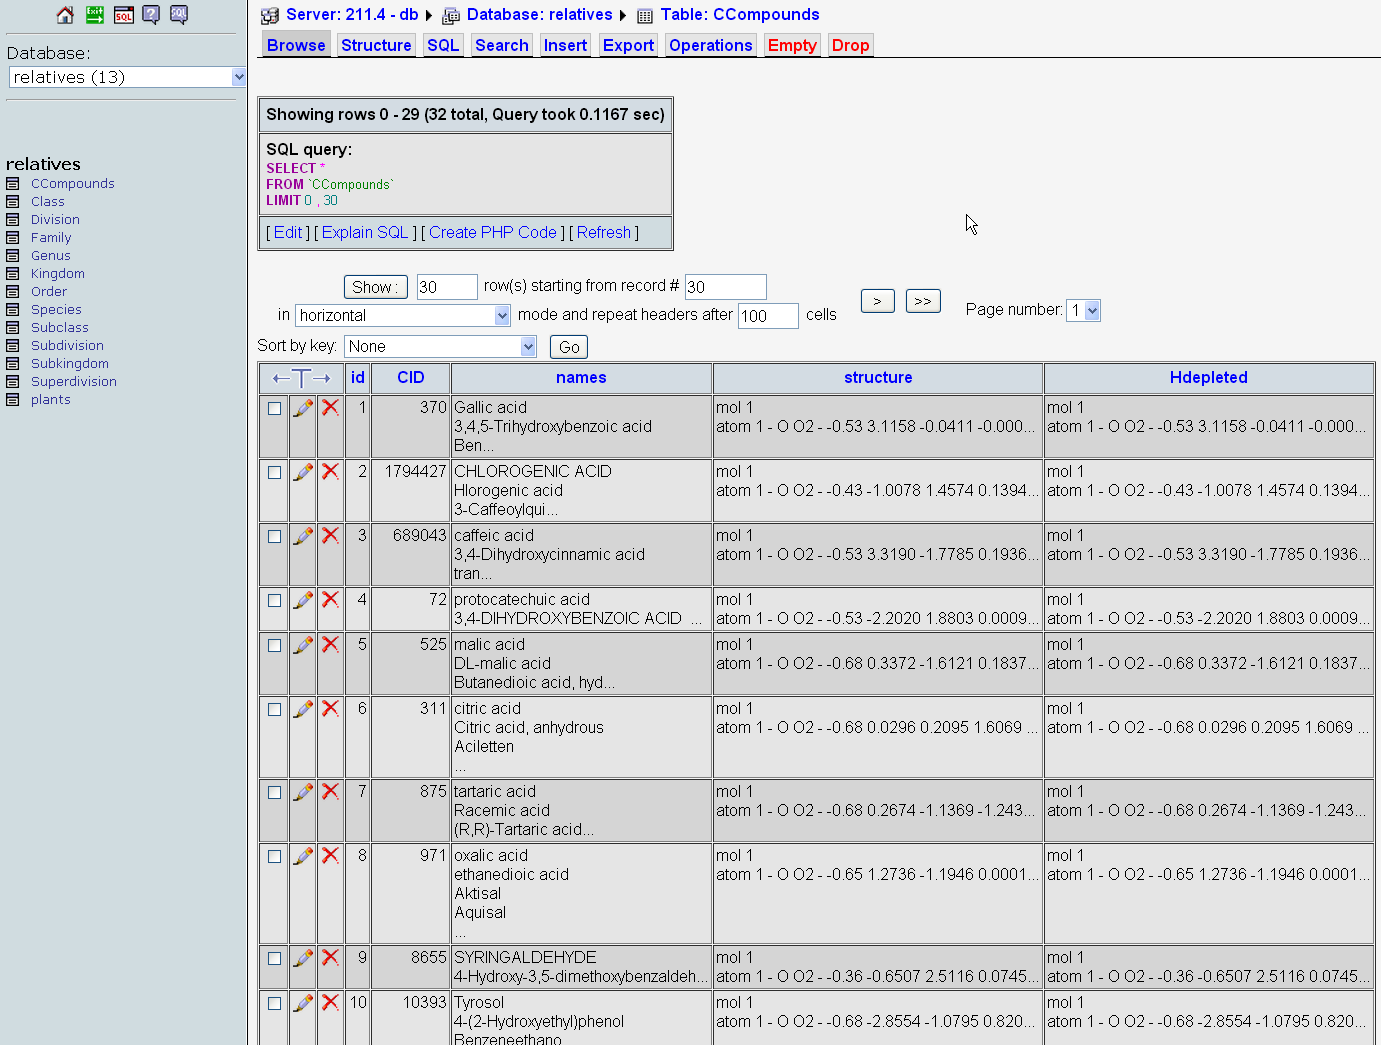
|
| 06 |
Relation between chemical structure and biological activity were considered. A study relating the potency of converting solar energy into chemical energy by the chlorophyls were conducted. 3D models of the cholorophyls structures were obtained and were used to relate with solar energy conversion efficiency.
Image: 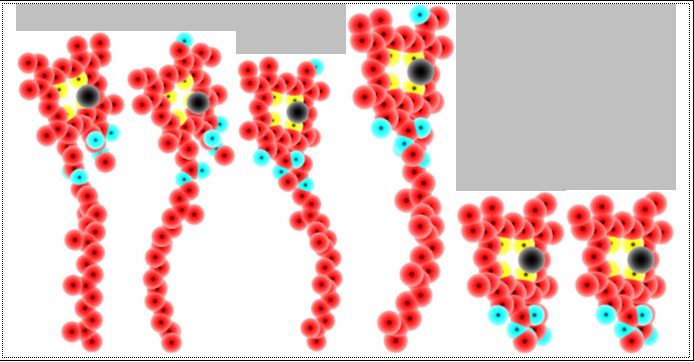
Later, from this study a paper were prepared, submited, accepted and published.
Manuscript version of the paper: Chlorophylls - natural solar cells
Published paper: Chlorophylls - natural solar cells
Authors: Lorentz JÄNTSCHI, Sorana D. BOLBOACA, Mugur C. BALAN, Radu E. SESTRAS
Acknowledgments:
|
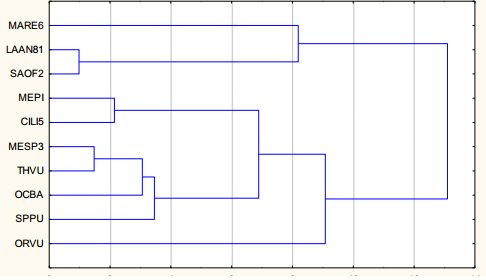
| 07 |
A series of plants from the opposite case, whithout chlorophyls were taken into study: algae from algele Prototheca genus.From NucCore database were downloaded a number of 15 nucleotide sequences for the species: blaschkeae, cutis, moriformis, stagnora, ulmea, and wickerhamii - the last one as complete genome. An analysis of the gene sequences were conducted using literals alignment (see image below).
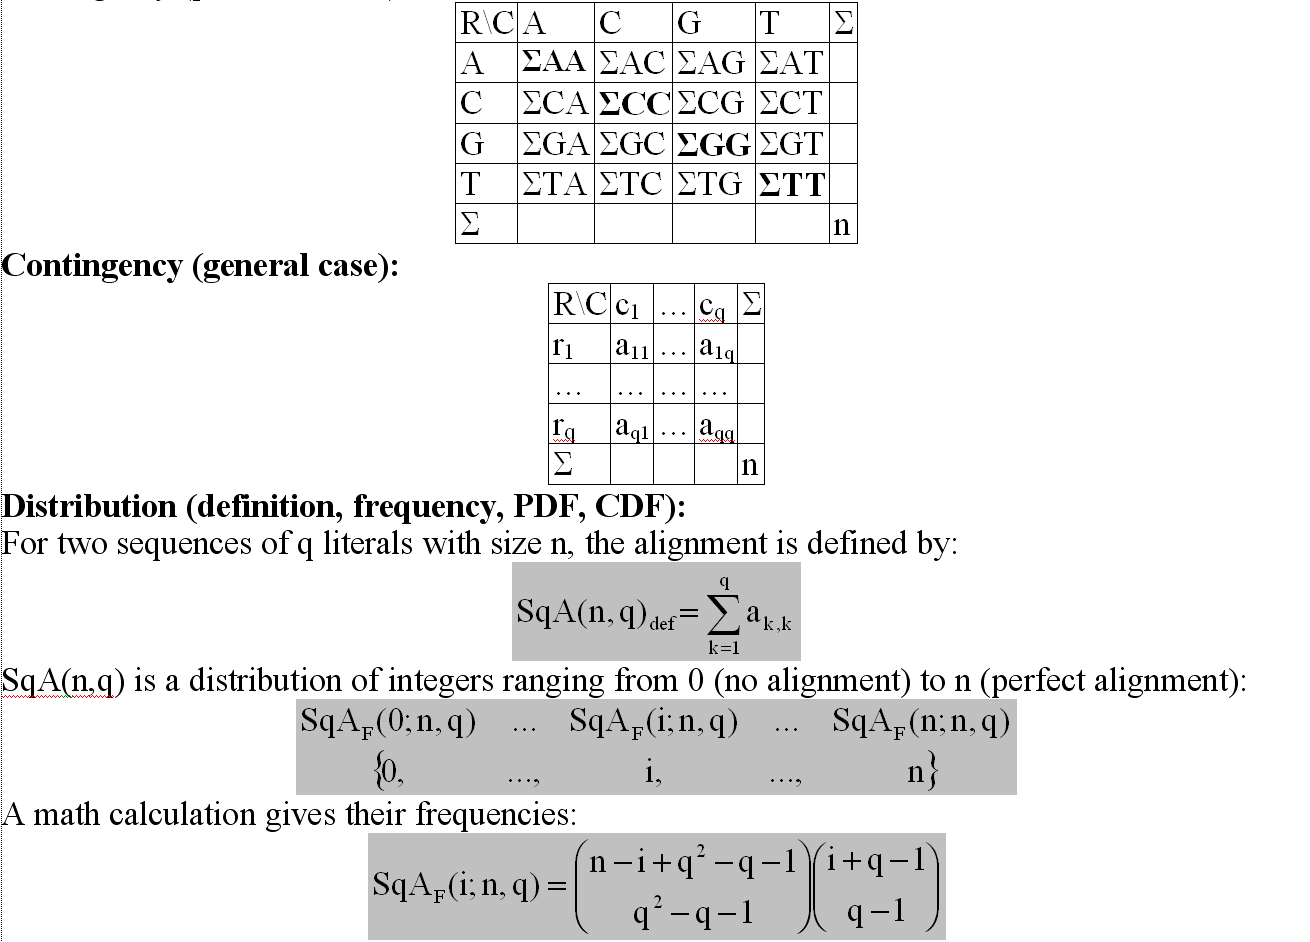
As can be seen above, a formula for alignments with at least all literals being used were obtained. The formula (see image above) contains two terms, from which the second one is the number of states from Bose-Einstein Condensate (see for instance: Einstein A, 1925. Quantum theory of the monatomic ideal gas. Meeting reports of the Prussian Academy of Sciences 1:3-10) and thus it seems that sequence alignment is a factorization of the condensate matter.
The results of sequence alignment is given below (see image below).
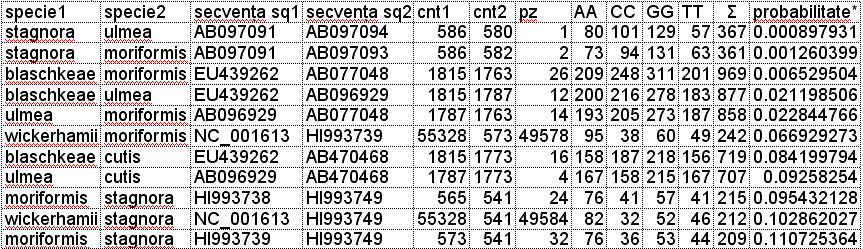
Column 'probabilitate' from the figure above give the exact probability of an alignment by chance, based on the sequences taken into the study.
As can be seen, for about half of these pairs, the alignment by chance is rejected and thus can be sayd that these species has certainly a common ancestor.
|
| 08 |
A study regarding the use of the 2X2 contingency (observed vs. model) and their linkage measures were conducted (see image below).
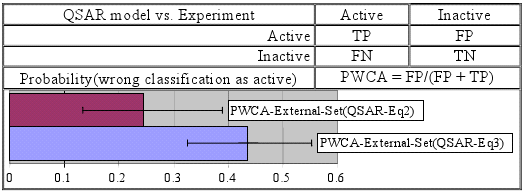
The study were subject of an article published later (image below):

Published paper: Predictivity Approach for Quantitative Structure-Property Models. Application for Blood-Brain Barrier Permeation of Diverse Drug-Like Compounds
Authors: Sorana D. BOLBOACA, Lorentz JÄNTSCHI
Acknowledgments:
|
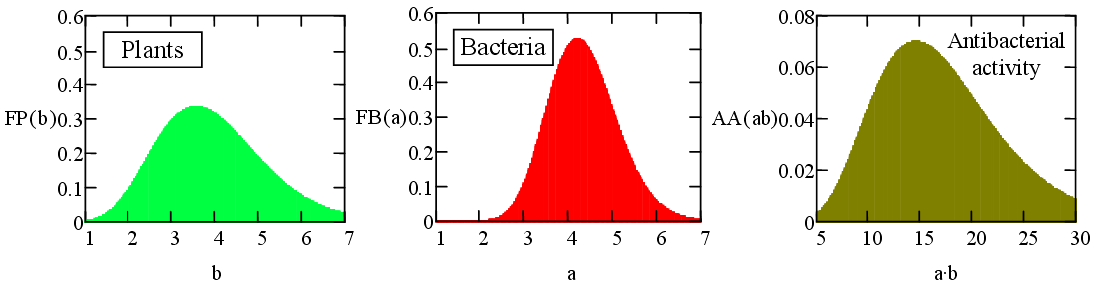
| 09 |
A wider analysis regarding the contingency in effect of essential oil extracts (mixture of compounds) from plant species on bacteria species were conducted. The posibility of factorization of the effect were explored.
A paper capitalized later the research results (image below).
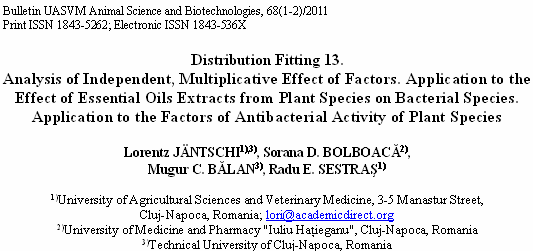
Manuscript version of the paper: Distribution fitting 13. Analysis of independent, multiplicative effect of factors. Application to effect of essential oils extracts from plant species on bacterial species. Application to factors of antibacterial activity of plant species
Published paper: Distribution fitting 13. Analysis of independent, multiplicative effect of factors. Application to the effect of essential oils extracts from plant species on bacterial species. Application to the factors of antibacterial activity of plant species
Authors: Lorentz JÄNTSCHI, Sorana D. BOLBOACA, Mugur C. BALAN, Radu E. SESTRAS
Acknowledgments:
As can be seen from the picture below, the factorizing of the effect reveals a different spread of factors influence: much wider is the spread of 'plant' factor than the spread of 'bacteria' factor.
|
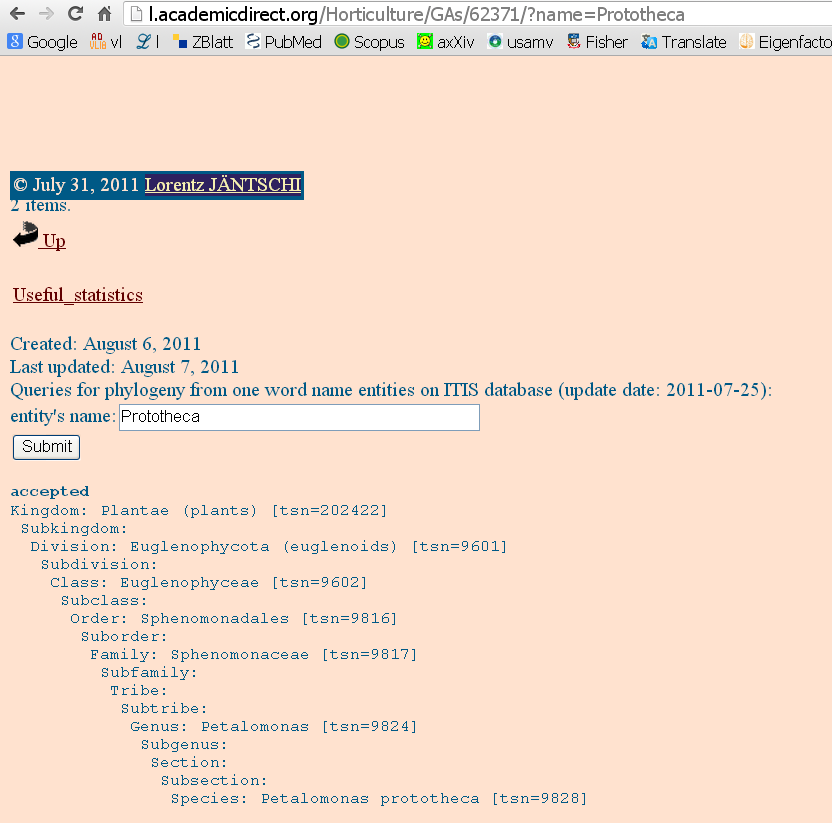
| 10 |
Storing of the phylogeny for a certain plant can become a 'hard problem' as can be seen from the study conducted on this subject. By using the same Prototheca genus a study regarding its classification were conducted. As the literature shows, exists different classifications (see image below, from resulted paper).
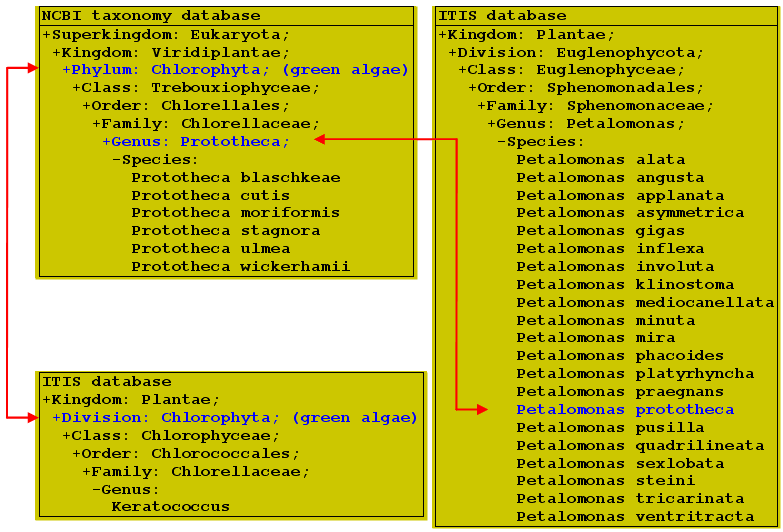
The two classification systems used for comparision were stored locally in two databases (see images below).
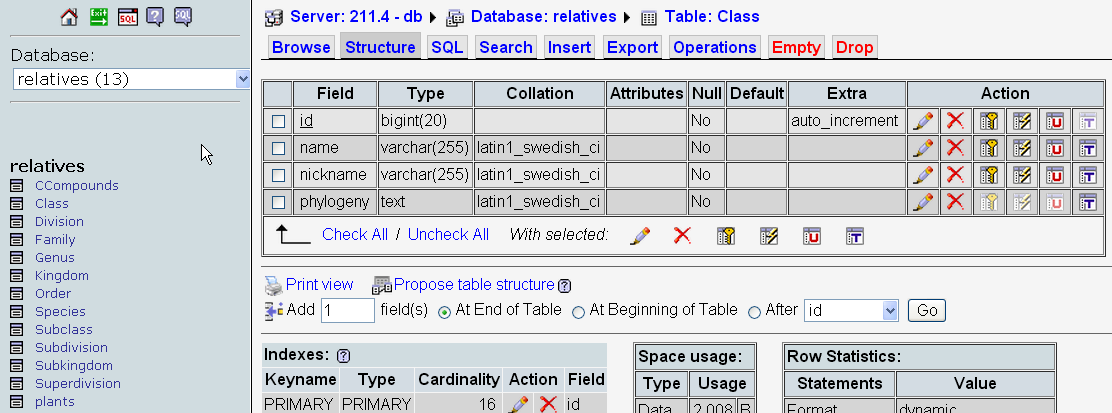 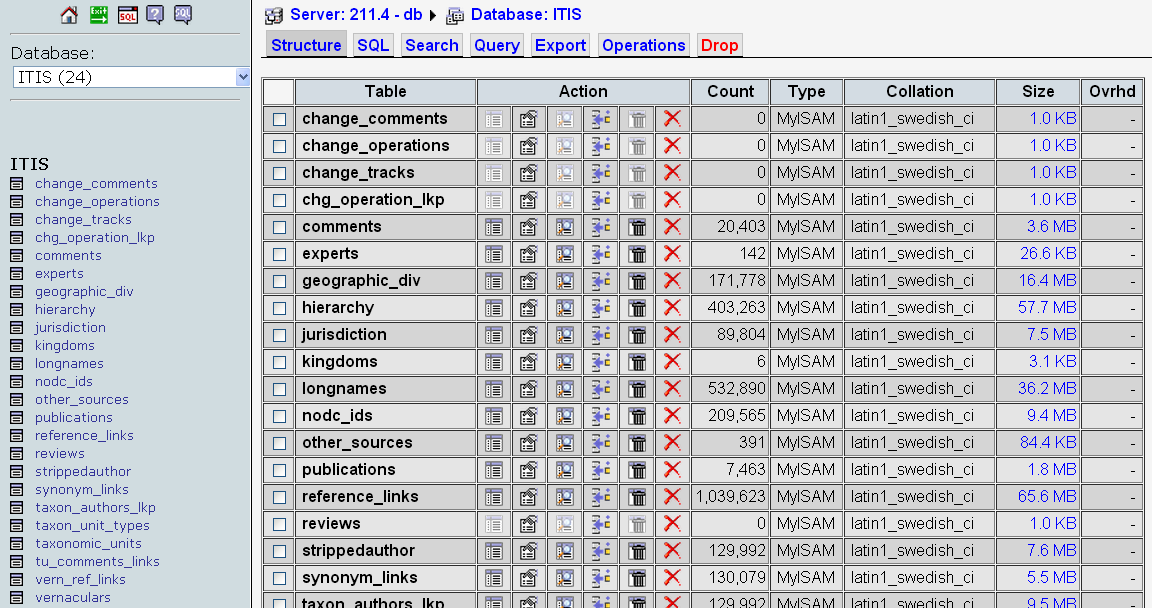
For the ITIS database a query interface were designed (see image below) and is available online at: http://l.academicdirect.org/Horticulture/GAs/62371/
|
| 11 |
Same problem of plant extracts (or the effect of mixing for chemical compounds) were taken into the analysis in order to reveal a similarity based on chemical composition (derived from plant metabolism).
The analysis were capitalized in a paper (see image below).
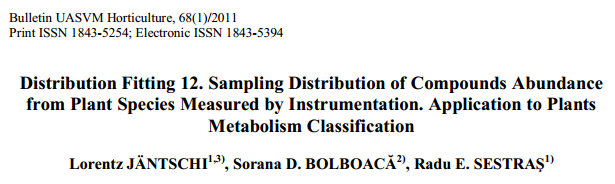
Manuscript version of the paper: Distribution fitting 12. Sampling distribution of compounds abundance from plant species measured by instrumentation. Application to plants metabolism classification
Published paper: Distribution fitting 12. Sampling distribution of compounds abundance from plant species measured by instrumentation. Application to plants metabolism classification
Authors: Lorentz JÄNTSCHI, Sorana D. BOLBOACA, Radu E. SESTRAS
Acknowledgments:
An important results were obtained: a classification based onmetabolism, which reveal a totally different one than the one from phylogeny (see image below).
|
| 12 |
By using a recenty feature of Google Chrome scripting language (so called HTML 5.0 standard, released by Google on August 2011, used here in November 2011) a well known old problem time consuming were solved: uploading of the multiple files to a server from 'one click' (or maybe two), not file-by-file, colectively selected and uploaded. It is a very important problem, because when working with chemical compounds, the compounds must bee find in different databases, downloaded locally, checked, optimized, and uploaded to a local database for analysis. And this procedure should be done in one click, but the security reasons existing in the previous versions of the HTML language denied this option, of multiple selection of files to be uploaded.
The image below gives the developed script using this feature (see image below).
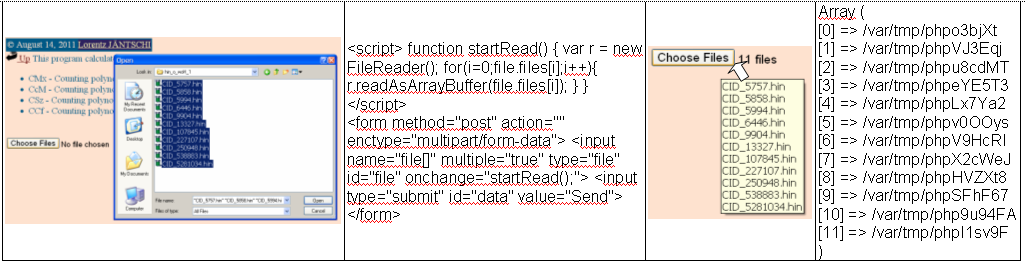
URL of this implementation:
http://l.academicdirect.org/Fundamentals/Graphs/indices/
|
| 13 |
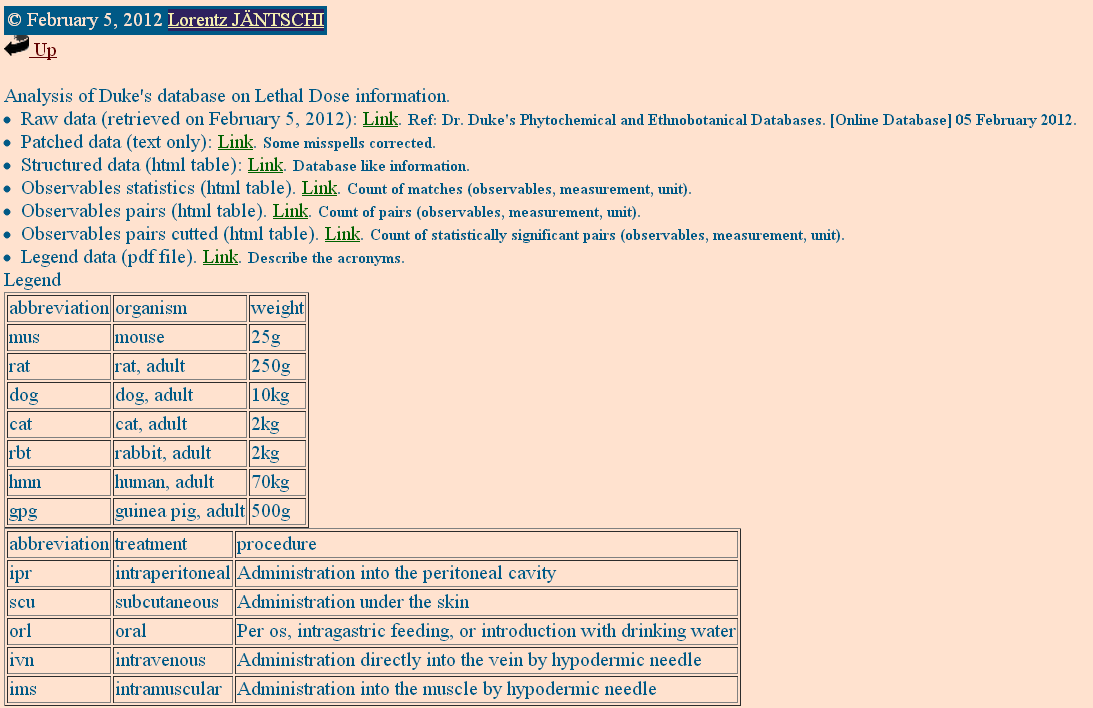
A valuable database containing a large number of experimental measurements were found. It is Dr. Duke's Phytochemical and Ethnobotanical Databases (http://www.ars-grin.gov/duke/). This database has been used to extract useful information. A series of steps has been followed in order to access the data in a relational database manner. These steps are:
- data import; software implementation: http://l.academicdirect.org/Horticulture/GAs/62371/Duke_db/?Duke=rawdata
- data validation; software implementation: http://l.academicdirect.org/Horticulture/GAs/62371/Duke_db/?Duke=patched
- information structuring; software implementation: http://l.academicdirect.org/Horticulture/GAs/62371/Duke_db/?Duke=structured
- queries for statistics; software implementation:
All these programs are online available (http://l.academicdirect.org/Horticulture/GAs/62371/Duke_db/) and the image below is a snapshoot of the portal created:
|
| 14 |
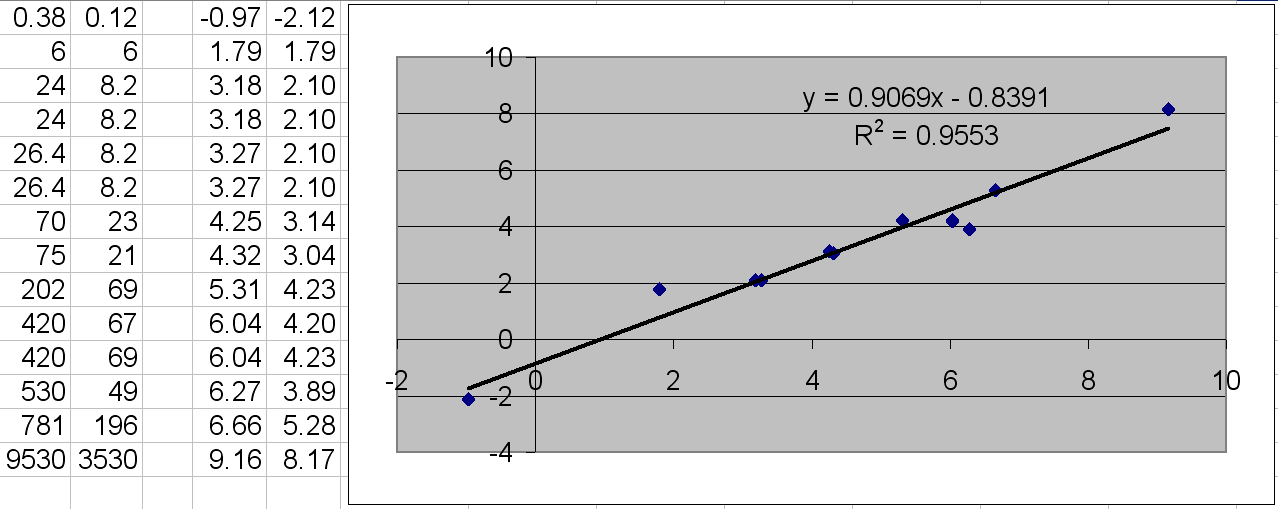
As continuation of the analysis conducted in the previous month, identification of the groups of data in such (as Duke's) databases were the subject of the investigation. For these particular cases, when a large block of data is available, seeking for linearities is possible. A procedure for seeking these linearities were developed. Two online applications are available as well as their results of analysis of the Duke's database:
- http://l.academicdirect.org/Horticulture/GAs/62371/Duke_db/?Duke=pairs
- http://l.academicdirect.org/Horticulture/GAs/62371/Duke_db/?Duke=cuts
Identified blocks of data meeting the defined criteria (for instance for a simple linearity dependence, we should consider at least 6 pairs of data) further analysis can be conducted using commercial software such Statistica or Excel.
The image below contains a such kind of analysis based on the filter (Organism='(ipr mus)')and(Measurement='') and is for intraperitoneal (administration into the peritoneal cavity) on mouse (of about 25g weight) and relates lowest lethal dose (LDlo) with 50% survival chance lethal dose (LD50) and the model given is on both scales expressed though logarithms.
|
| 15 |
Data treatment were taken into study in order to obtain the coefficients for crossover. Following list iterates the steps:
- Obtaining the pairs of experimental data;
- Obtaining of the Training+Test superset (in which all values of each pair has a numerical measurement);
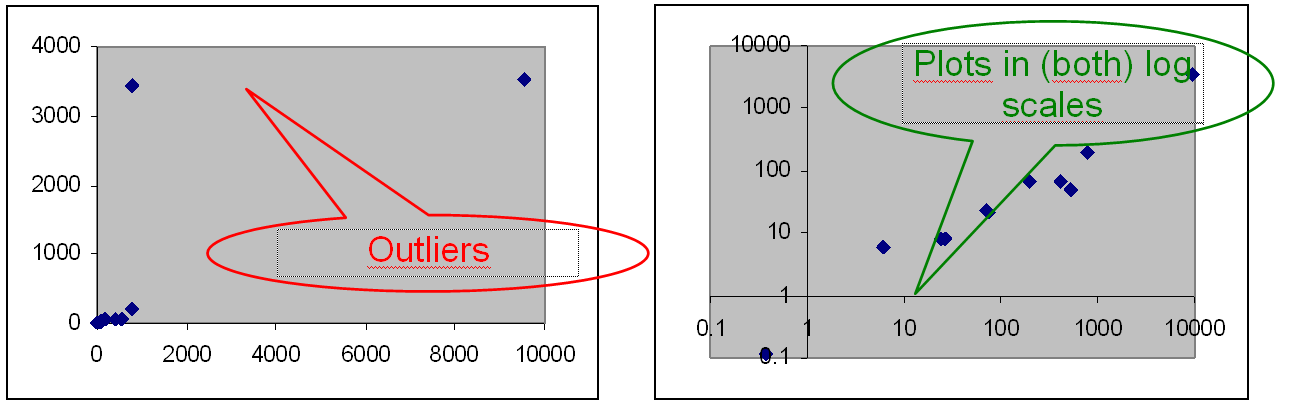
- Seeking for outliers; a outlier identification were depicted below; see for instance that both outlier detection and normalization of the data can be considered as being paired procedures (one without the other has no sense);
- Checkig of accomplishing of some normalization of the data; uses Chi-Square test, Anderson-Darling test, Kolmogorov-Smirnov test;
- Split of the data in Traing and Test sets in a ratio of Training:Test = 2:1;
- Using of the Training model for training (obtaining of the regression coefficients);
- Using of the Test data for testing the model (calculation of the correlation under the supposition of the model obtained from training);
|
| 16 |
In order to give a true estimate of the crossover when only a part (M < N) of a paired data (of size N) is taken all possible extactions should be made, and the the average result is a true estimate of the cross validation. In order to do this, the algorithm described in the paper [Phillip J. CHASE, 1970. Algorithm 382: Combinations of M out of N Objects [G6]. Communications of the Association for Computing Machinery 13(6):368-368] were used to implement the succesive draws of M elements from a set of N. The procedure has ben further tested on the full (15 pairs of data) and the normalized data (14 pairs of data) from the Duke's database. The results are given in the next image.
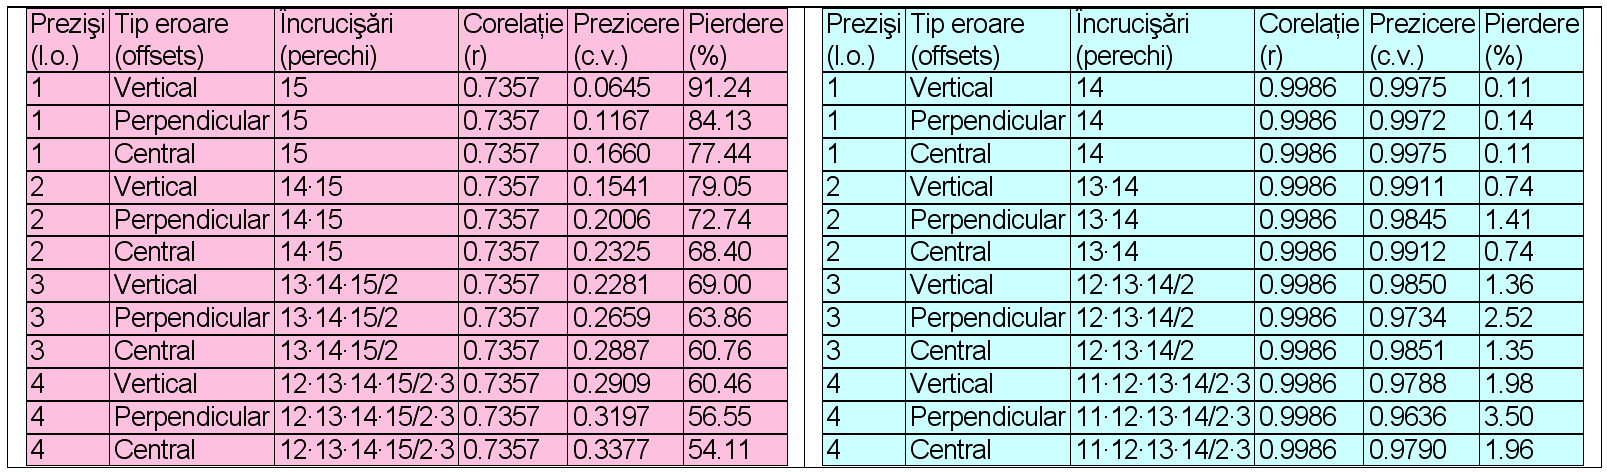
Results shows that the perpendicular offsets performs worster in the presence of the outliers.
|
| 17 |
Intensive measures for diversity were taken into analysis. Two measures were selected for further analysis: Renyi Entropies family (left in the image below) as being representative for observed diversity and Fisher's alpha (right in the image below) as being reprezentative for estimated diversity [Refs: Rényi, A. 1961. On measures of information and entropy. Proceedings of the 4th Berkeley Symposium on Mathematics, Statistics and Probability, 547-561; Fisher, RA. 1943. Part 3. A theoretical distribution for the apparent abundance of different species. Journal of animal ecology 12:54-58].
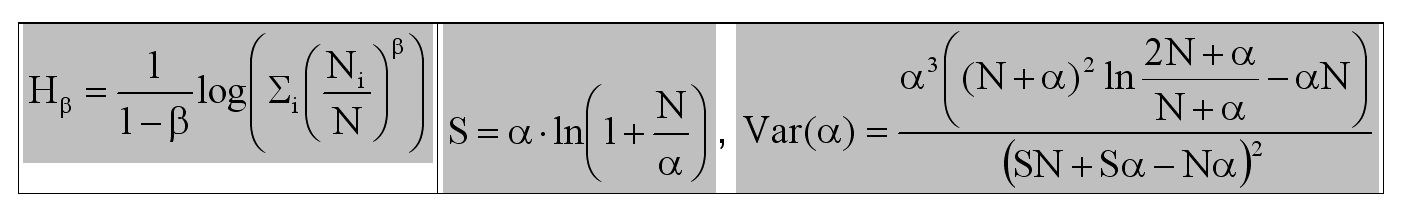
where N = sum(Ni) and S = count(Ni) and Ni are the number of individuals observed for each species in part.
|
| 18 |
Mobility. A series of conclusions has been drawn from the study visit in Germany and Holland, given below:
- 'German' solution to competitiveness is seen at the local government (the State) to engage in partnership offerings (tools) to private owners (banks and investment funds) and public (local authorities), institutes of education and research (including universities), and entrepreneurs in defining projects of research and innovation policies (the so-called 'clusters') in consultancy projects and dissemination (through limited liability companies established joint ownership), and knowledge transfer projects in innovation (managed and funded by its first two instruments);
- 'Dutch' solution to competitiveness is to create a robust national financing activities mainly aimed at shortening innovation and technology transfer is addressed mostly small and medium size investors through a grant process in 2 steps the success rate from phase 1 funding (approximately 10% of total funding) in phase 2 funding is between 30% and 50%;
- Both solutions aimed at attracting private sector research and innovation by funding almost exclusively to innovation component.
|
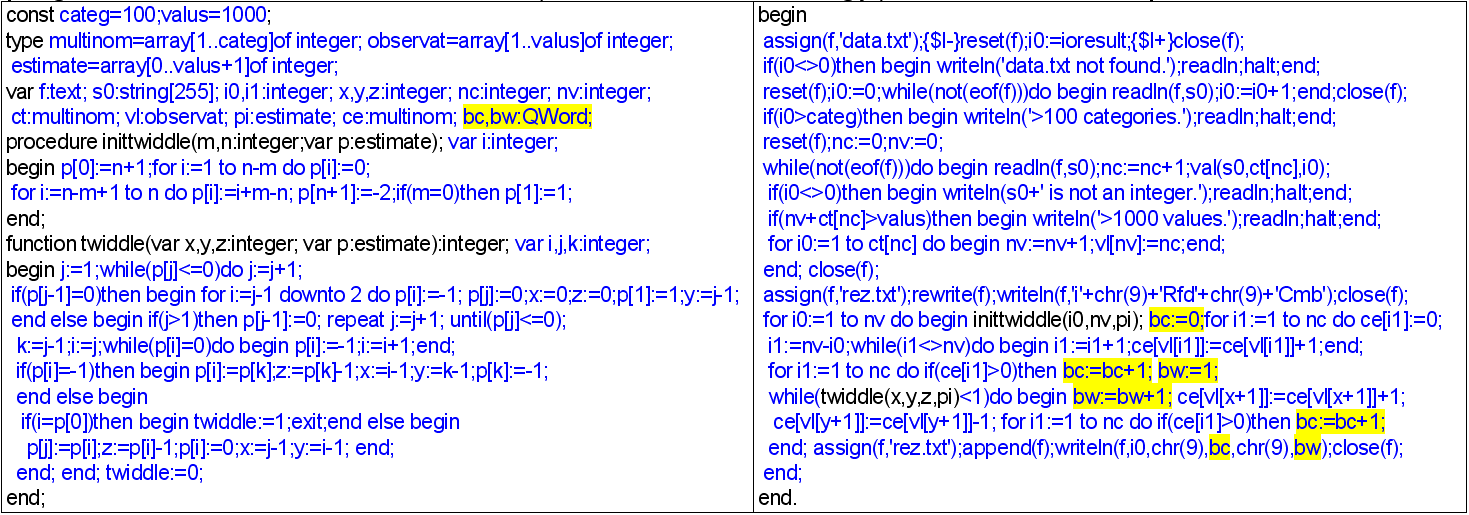
| 19 |
Among with Fisher's method, other methods of diversity estimation were taken into study, namely:
- Fisher's alpha; Fisher RA, 1943. Part 3. Theoretical distribution for the apparent abundance of different species. J Anim Ecol 12:54-58.
- Bootstrap clasical; Efron B, 1979. Bootstrap methods: another look at the jackknife. Ann Stat 7(1):1-26.
- Bootstrap modified; Efron B, Tibshirani RJ, 1993. Chapter 14. Of: An introduction to the bootstrap. Boca Raton: Chapman & Hall/CRC.
- Jackknife (first order); Quenouille MH, 1949. Approximate tests of correlation in time-series. J R Stat Soc B 11(1):68-84.
- Jackknife (second and third order); Quenouille MH, 1956. Notes on bias in estimation. Biometrika 43(3-4):353-360.
Software implementations of these two metods (Bootstrap and Jackknife) were made (see image below).

An analysis regarding the estimation of the numbers of flowers were conducted using these methods. The study were later capitalized in a paper (see image below).

Manuscript version of the paper: Distribution fitting 16. How many colors are actually in the field?
Published paper: Distribution fitting 16. How many colors are actually in the field?
Authors: Lorentz JÄNTSCHI
Acknowledgments:
|
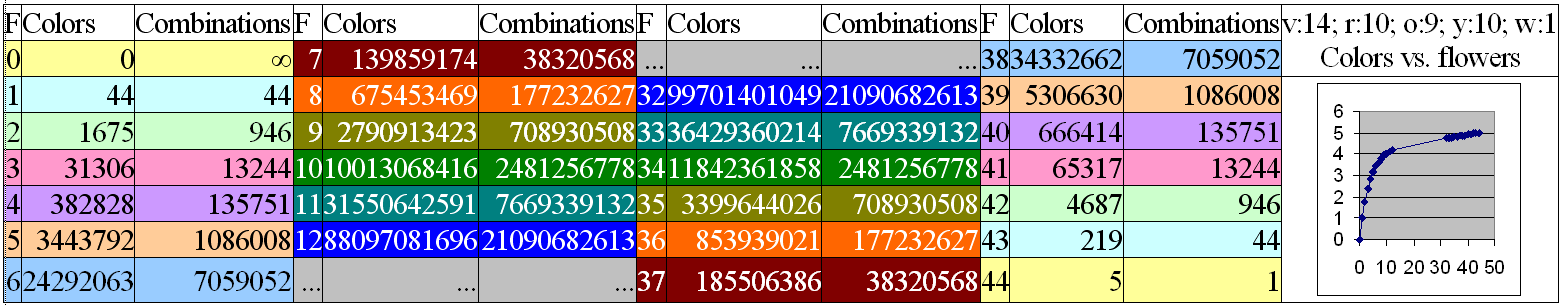
| 20 |
The rarefaction method for estimating the diversity from the sample were implemented (see image below).
The method where used to draw the rarefaction curve for the sample of flowers drawn from the field (v:14; r:10; o:9; y:10; w:1). The analysis shown a nice curve but with a very intensive calculation (see image below).
|
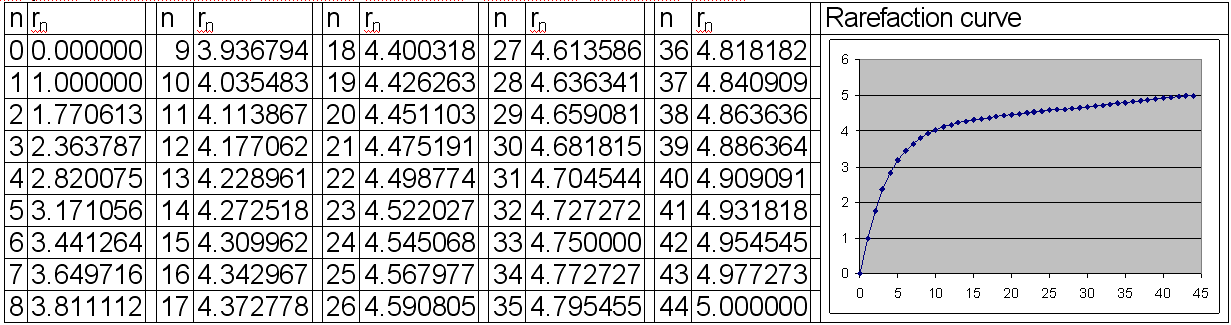
| 21 |
The same study from previous month were implemented with the result from combinatorics giving the number of rarefied colors. The implemented code is given below:
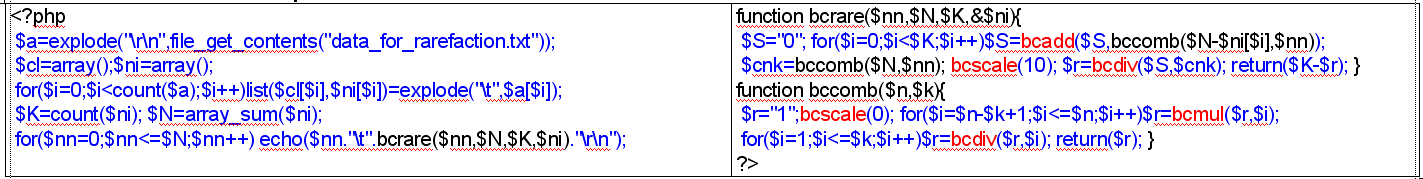
With this result, a much easier and faster rarefaction curve were obtained (see below):
|
| 22 |
The use of the entropy measures (Renyi) to compare the genus based on chemical composition were conducted. The results are given below:
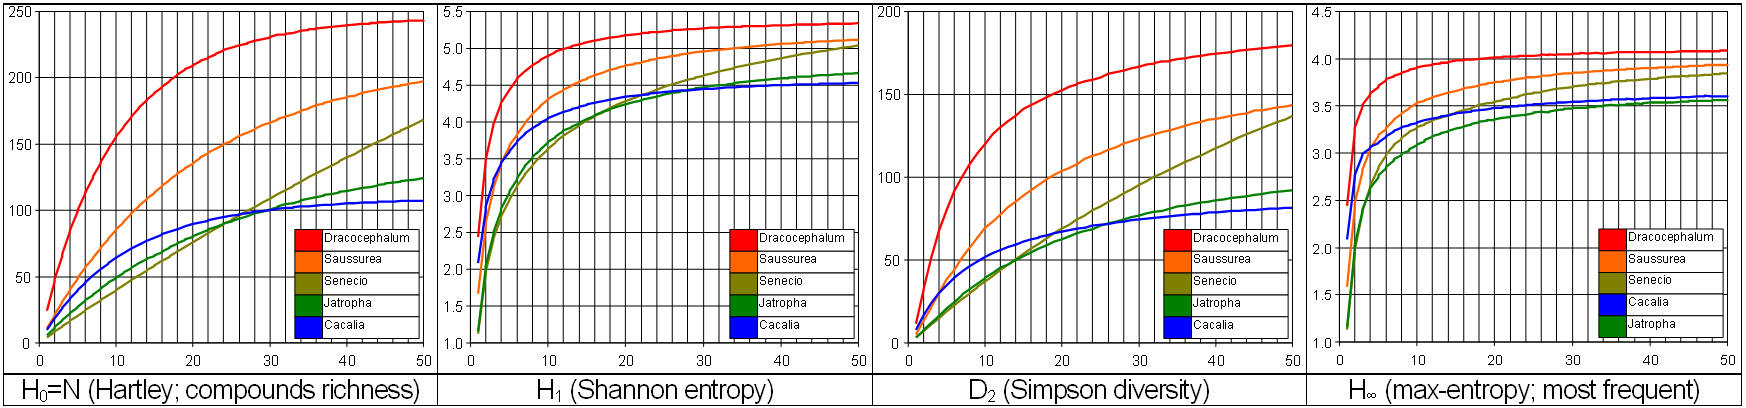
Note: Experimental data from: Chem Biodivers: 2010;7(1):105-115, 2010;7(8):1911-1929; 2009;6(12):2166-2183; 2010;7(11):2623-2807; 2011;8(1):13-72.
|
| 23 |
The use of the molecular families of deschiptors is a manner to relate the chemical structure with the biological activity. A study regarding the distribution of the correlation coefficients were conducted in order to identify the type of the distribution for the set of descriptors providing an agreement between the chemical structure and the observed property by using molecular descriptors obtained via MDFV methodology [Bolboaca SD, Jäntschi L, 2009. Comparison of QSAR Performances on Carboquinone Derivatives, TheScientificWorldJO 9(10):1148-1166. DOI: 10.1100/tsw.2009.131]. The toxicity measured at different stages of development for the species Arbacia punctulata, Dinophilus gyrociliatus, Sciaenops ocellatus, Opossum shrimp and Ulva fasciata. A number of 24 observed biological activities for a number of 8 compounds served in this investigation [U.S. Geological Survey, Marine Ecotoxicology Research Station, Texas A&M University-Corpus Christi, Center for Coastal Studies. Development of marine sediment toxicity for ordnance compounds and toxicity identification evaluation studies at select naval facilities. http://web.ead.anl.gov/ecorisk/issue/pdf/tox_marine_sed.pdf]. The results shown a partition of distribution functions as below.
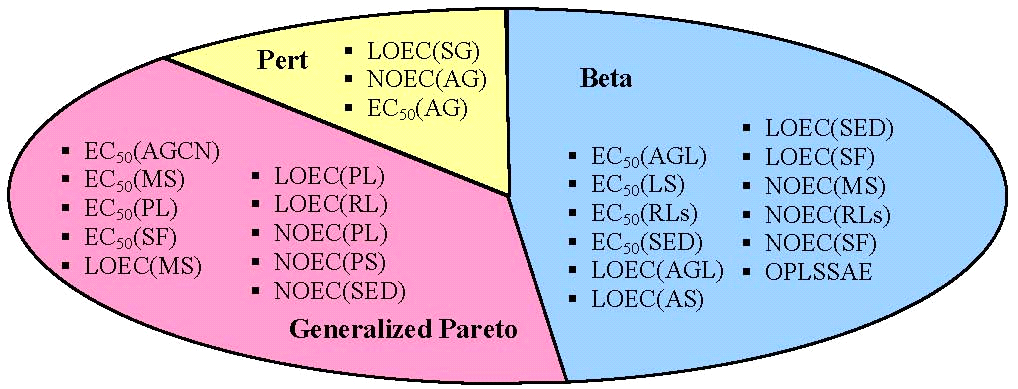
The results were later published (see image below).
Published paper: Distributing Correlation Coefficients of Linear Structure-Activity/Property Models
Authors: Lorentz JÄNTSCHI, Sorana D. BOLBOACA
Acknowledgments:
|
| 24 |
A new methodology relating the chemical structure with the biological activity were designed: SAPF. The result were capitalized in a publication (see image below).
Published paper: Quantum Mechanics Study on a Series of Steroids Relating Separation with Structure
Authors: Radu E. SESTRAS, Lorentz JÄNTSCHI, Sorana D. BOLBOACA
Acknowledgments: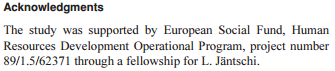
The SAPF methodology acts as depicted:
With the help of this methodology a complex study regarding the overall biological activity of a class of compounds were conducted (see representation of the 'overall' below):
The study were the subject of a paper which was later published (see image below).
Published paper: Poisson Parameters of Antimicrobial Activity: A Quantitative Structure-Activity Approach
Authors: Radu E. SESTRAS, Lorentz JÄNTSCHI, Sorana D. BOLBOACA
Acknowledgments:
|
| 25 |
A study continuing the research from PhD Thesis in Horticulture (2010) were conducted in order to estimate the moments of evolutions in different selection and survival strategies. The study reveals that the relative moments of evolutions are shaped by a one-parameter degeneration of the log-Pearson type III distribution. The results conducted on a given data sample allowed to extract the parameters of these distributions (see image below).
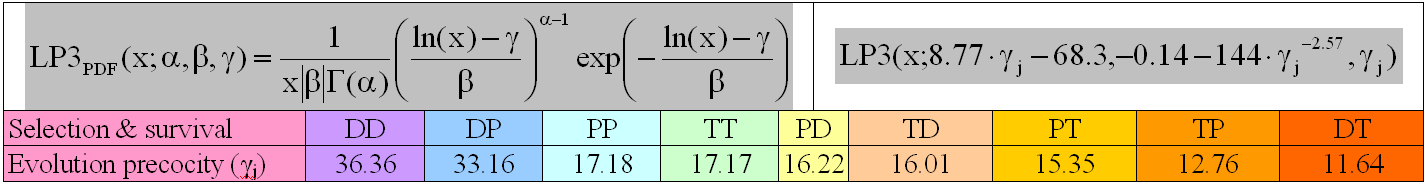
The study were capitalized in an article (see image below).
Published paper: A Simulation Study for the Distribution Law of Relative Moments of Evolution
Authors: Lorentz JÄNTSCHI, Sorana D. BOLBOACA, Radu E. SESTRAS
Acknowledgments:
|
| 26 |
Further capitalization of the knowledge from the study conducted in the project were regarding the distribution of the seeds sizes (data from the buyed book describing the species from Transylvania region). A very nice picture of the seeds sizes distribution were obtained (see image below).
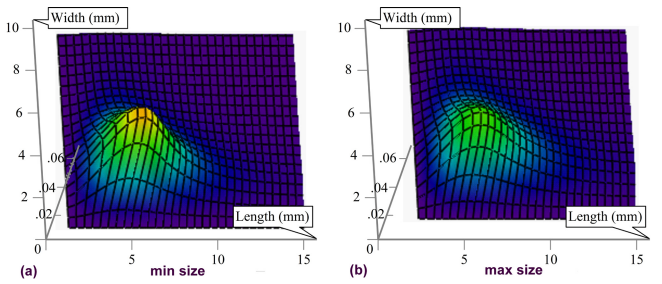
The study were published in a paper.
Published paper: An analysis of the distribution of seed size: a case study of the Gymnosperms
Authors: Lorentz JÄNTSCHI, Rodica C. SOBOLU, Sorana D. BOLBOACA
Acknowledgments:
|
| 27 |
Further capitalization of the knowledge from the study conducted in the project were regarding the effect of the leverage and of the influential on the quality of the structure-activity relationships.
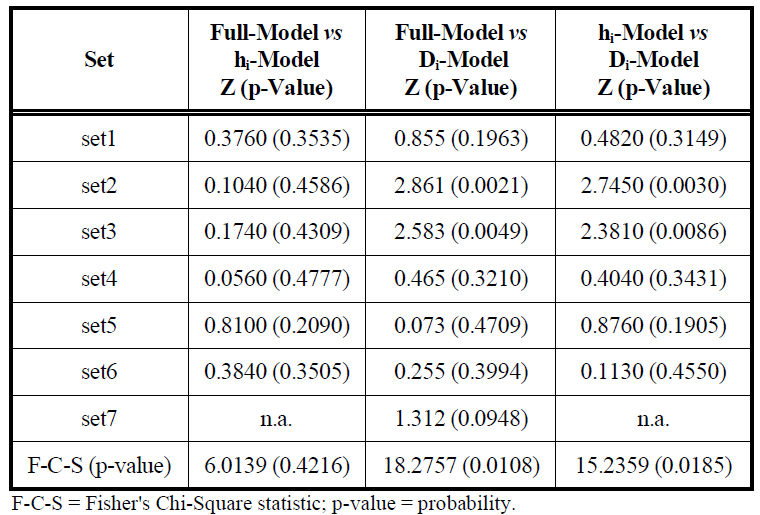
The study shows that the Di model has the biggest change relative to the initial model (see image below)
The work were published in a paper.

Published paper: The Effect of Leverage and/or Influential on Structure-Activity Relationships
Authors: Sorana D. BOLBOACA, Lorentz JÄNTSCHI
Acknowledgments:
|